This was an exciting year for Unfolding Maps! We released it for Processing 2, and upgraded to the new library mechanism so it can be installed from within the IDE, now. In the last year, Unfolding has been downloaded over 5000 times, and a wide span of visualization projects have been created. Find below a selection of one project for each month in 2014. Made with Unfolding.
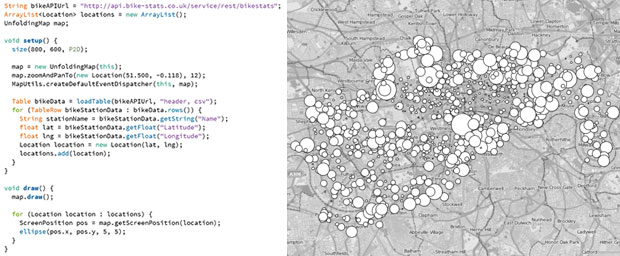
Super small Unfolding example to load real-time data of the Boris Bike scheme. Created for a workshop at the Royal College of Art London.
By Till Nagel, http://unfoldingmaps.org/rca
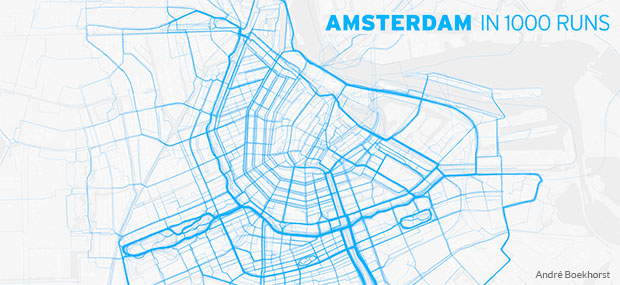
Public running routes from RunKeeper in Amsterdam.
By André Boekhorst, http://andreboekhorst.nl/portfolio/amsterdam-1000-runs/
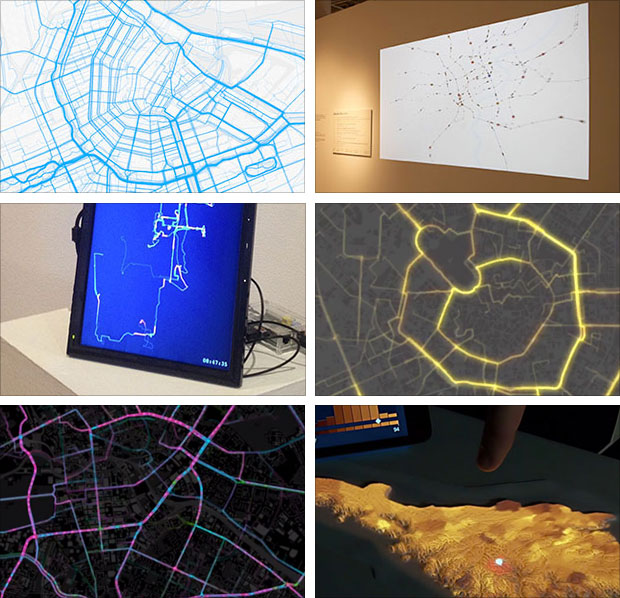
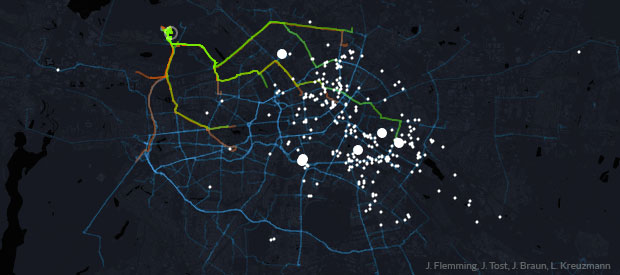
Visualizes taxi trips in Berlin. Uses pickup and drop off locations scraped from a taxi service, and assumed paths from a routing service.
By Jakob Flemming, Jordi Tost, Julian Braun, and Lars Kreuzmann (FH Potsdam), https://incom.org/projekt/4291
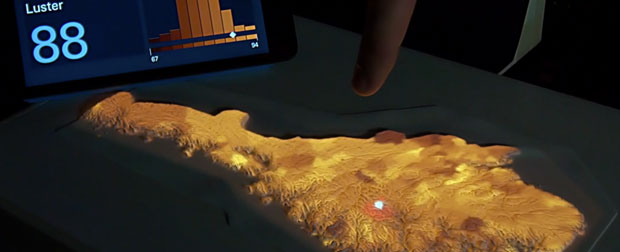
A physical platform for interactive data visualization on three-dimensional surfaces.
By Jon Olav Eikenes, http://www.navimationresearch.net/2014/the-vizbox-experiments/
A time-lapse video that visualises the growth of London through time.
By Sian Elliott, Kostas Nikolaou, Evangelos Pournaras, and Mahdi Nayebi (CASA UCL) https://activethames.wordpress.com/open-thames/

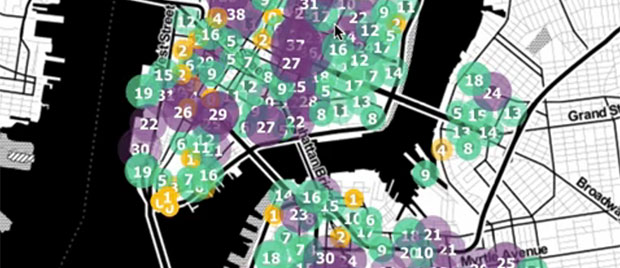
Shows available bike numbers at each bike station for a week in New York City.
By Suhong Seo, http://challenger43.me/projects/citibike-now/
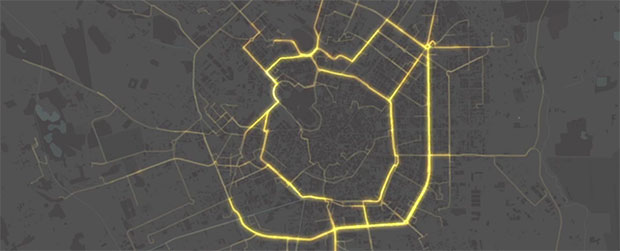
Exploring and visualizing the Enjoy carsharing service in Milan.
By Matteo Azzi, Daniele Ciminieri, Tommaso Elli, Emilio Patuzzo, Alessio Sciascia, and Giorgio Uboldi (Density Design Lab), http://labs.densitydesign.org/carsharing/
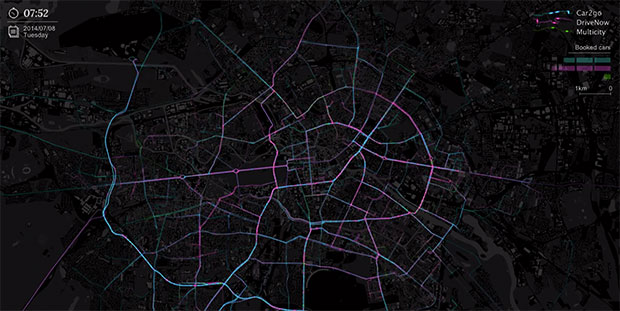
Visualizes free floating carsharing systems in Berlin over a day. The animation shows carsharing timelapse during the soccer worldcup semi-final Brazil-Germany.
By Patrick Stotz (Mappable), http://matters.civity.de/index_en.html
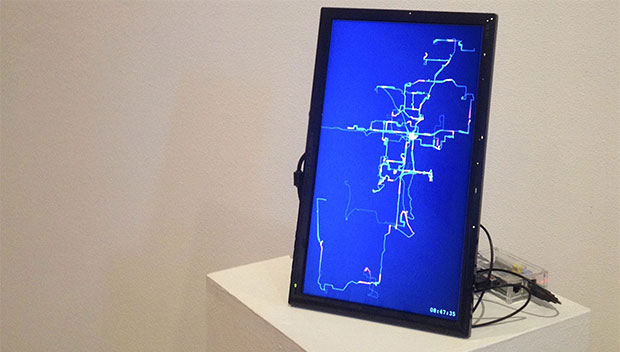
A video installation animating buses according to their schedule, as small blue and red circles with fading trails, in a sped up 24 hour cycle of a weekday in Central Florida.
By Nathan Selikoff, http://nathanselikoff.com/works/searching-flow-tropical-city
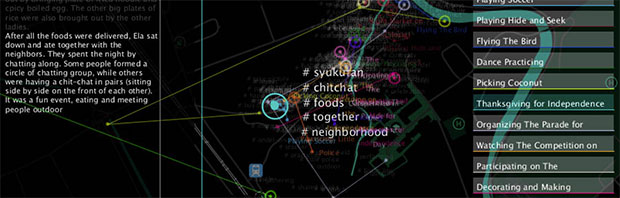
Mapping the narratives of urban context. Mapping Stories becomes a way to unfold the richness of spatial experience, to understand how the ingredients of the stories are interrelated, and to comprehend the continuity of spatial experiences.
By Paramita Atmodiwirjo, Yandi Andri Yatmo, and their research group at the Department of Architecture, Universitas Indonesia, http://mapping-stories.com/
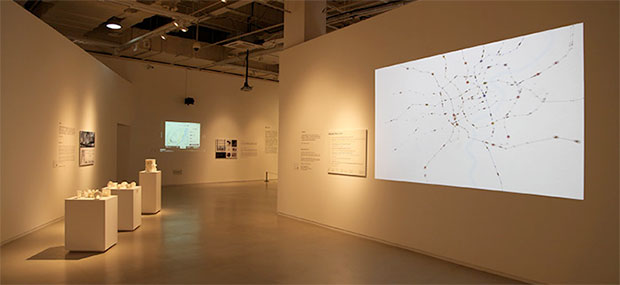
An animated visualization of Shanghai’s subway network. Consisting of three visualization scenes, with one morphing between geographical and schematic map views. Exhibited at the Shanghai Design, and the IEEE VIS Art Program in Paris.
By Till Nagel, and Benedikt Groß, http://tillnagel.com/2013/12/shanghai-metro-flow/
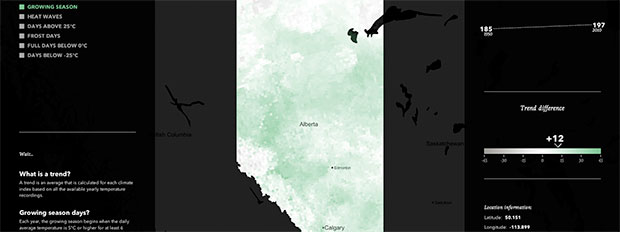
Part of an exhibition to provide an opportunity for people in Alberta to have access to the climate data that indicates change in ‘their backyard.’ This visualization enables the audience to look at the climate data itself.
By Chris Clark, http://www.chrisann.ca/exhibition/